Real-time monitor telemetry
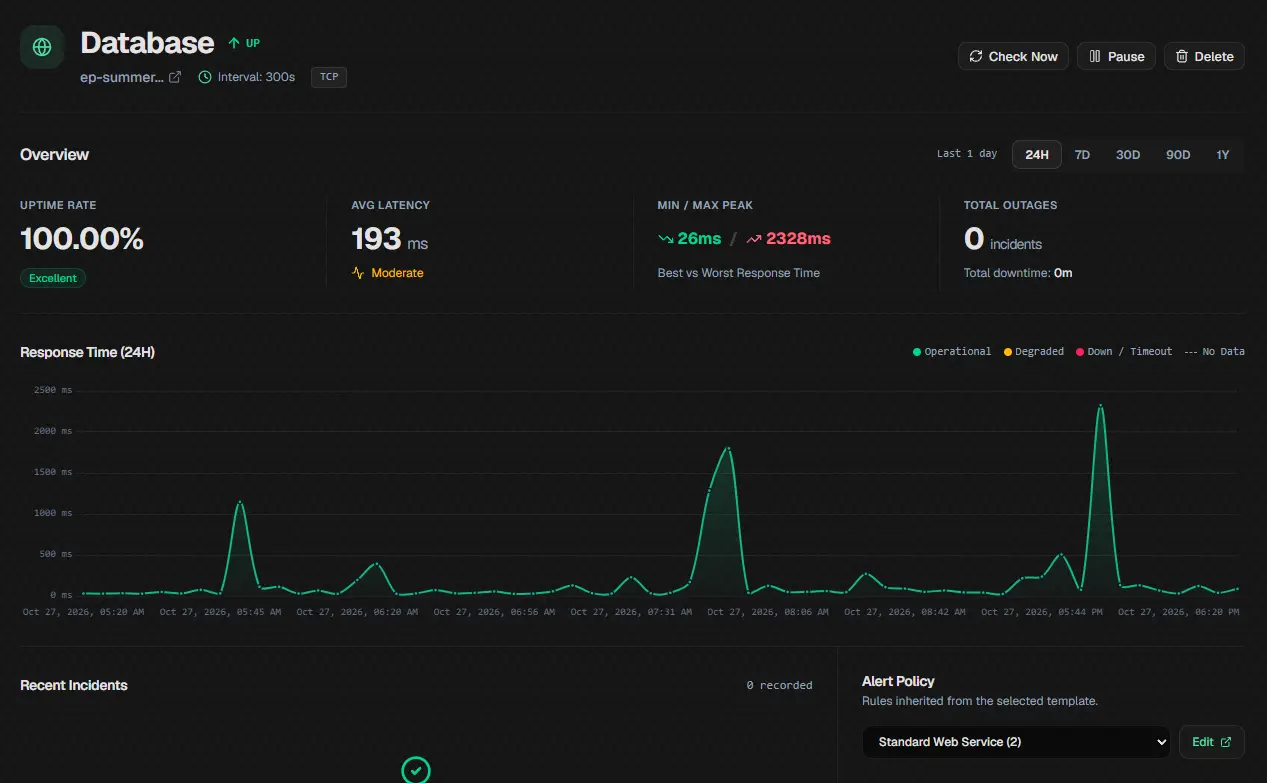
Monitors documentationTrack response times, uptime ratios, and check history across all endpoints in a live WebSocket-driven dashboard. Trigger manual checks on demand.
Netra Uptime is a single-container Go and Svelte monitoring platform backed by PostgreSQL or embedded SQLite with thread-safe in-memory caching. Track HTTP, TCP, Ping, SSL, and domain expiry, manage incidents automatically, and route alerts to Slack, Discord, email, or webhooks.
$ npx netra-uptime start localhost:27346 Manual Docker setup 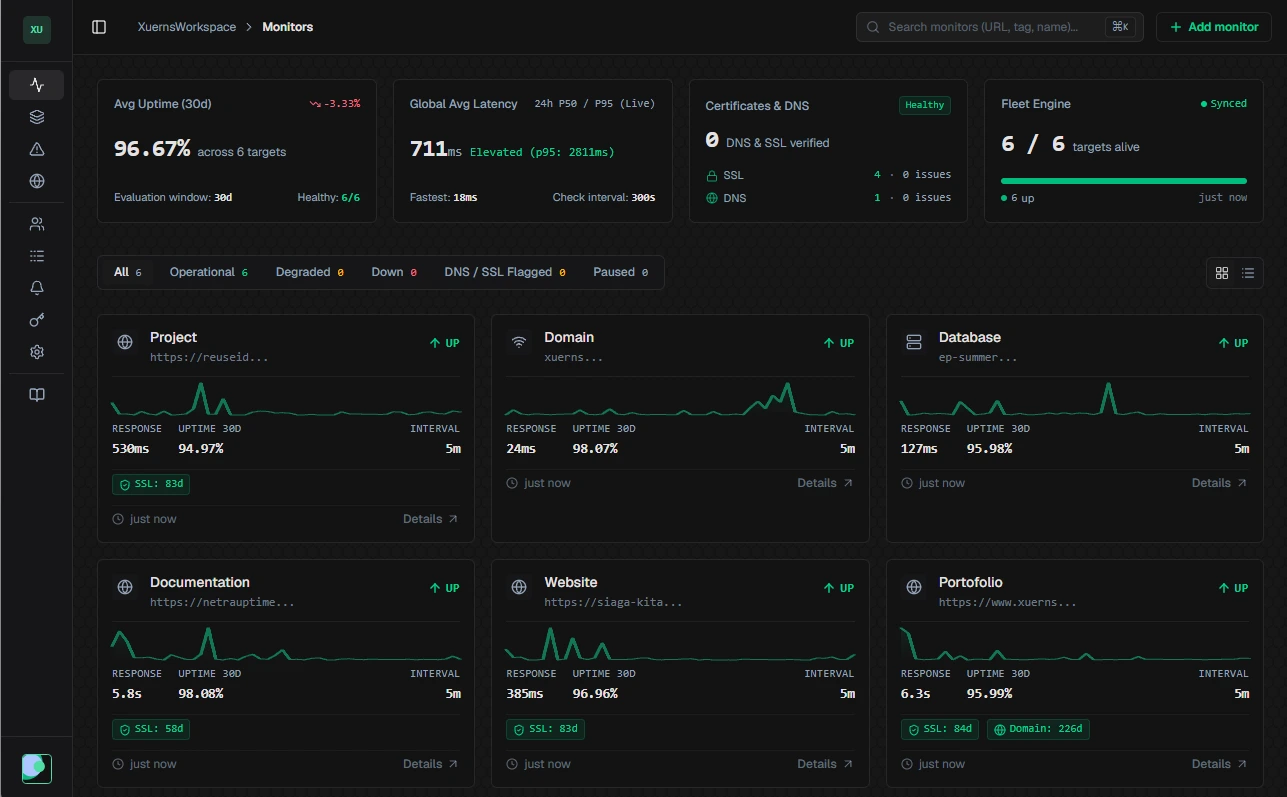
Initialize configuration and launch containers with a single command.
Production topology, persistent volumes, and database backup guides.
Go worker pool, alert state machine, and in-memory caching internals.
Interactive endpoint specifications, authentication scopes, and curl examples.
Core monitoring, incident management, alerting, and public status pages compiled into a single deployment.
Track response times, uptime ratios, and check history across all endpoints in a live WebSocket-driven dashboard. Trigger manual checks on demand.
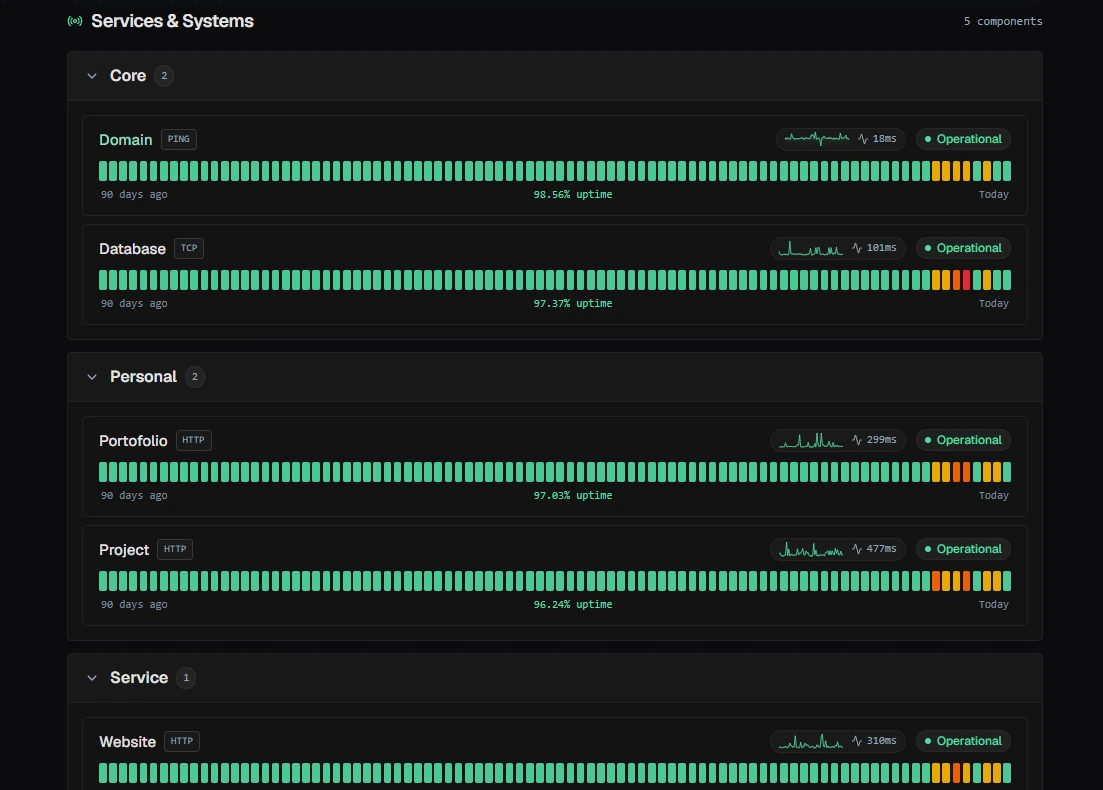
Publish 90-day uptime bars, component groups, scheduled maintenance windows, and machine-readable JSON feeds on custom subdomains.
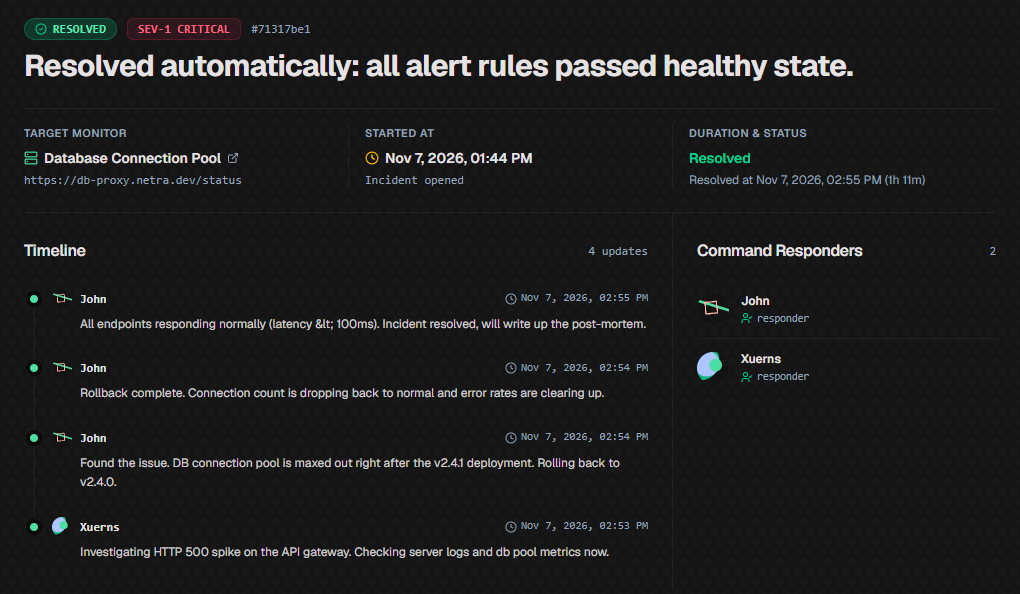
Incidents open on breach and resolve automatically upon recovery. Assign a Person-in-Charge and record timestamped status transitions.
Evaluate status codes, latency thresholds, and timeouts with consecutive breach counters to eliminate false-positive alert fatigue.
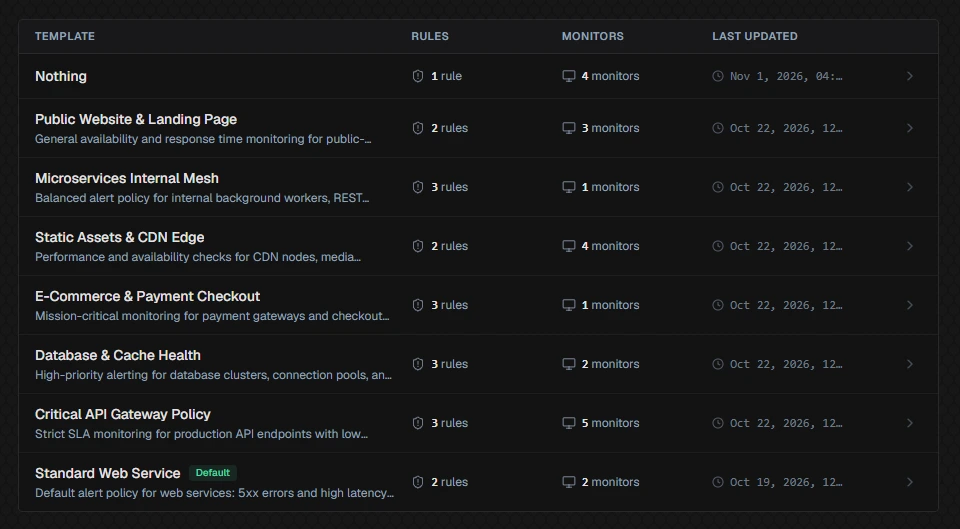
HTTP/HTTPS status and latency assertions, TCP port handshakes, and unprivileged Ping reachability probes.
Daily background worker tracking TLS certificate chains and WHOIS/RDAP domain expiration.
Deliver alerts to Slack, Discord, SMTP email, and SSRF-protected custom HTTP webhooks.
Multi-tenant organizations with Owner, Admin, and Member roles plus scoped REST API keys.
Interactive simulation
Trigger an outage and follow the alert state machine in real time: consecutive breach counting, automatic incident lifecycle, and multi-channel dispatch. Restore early to see false positives suppressed.
GET /health / every 30s / threshold 3 breaches
Uptime (window)
100.00%
Avg latency
98ms
Breach counter
1 tick = 1 check (30s simulated)
GET /health 200 OK / 254ms
09:41:00GET /health 200 OK / 74ms
09:40:30GET /health 200 OK / 96ms
09:40:00 Slack Idle
 Discord Idle
A single Go binary serving the REST API, concurrent check workers, and compiled Svelte frontend, backed by PostgreSQL or SQLite with zero external cache dependencies.
 Go Worker Pool
Deterministic tick scheduler and bounded goroutine worker pool executing HTTP, TCP, and unprivileged Ping probes concurrently.
 Rule Evaluator
Separates amber timeouts from red connection failures and enforces consecutive breach counts before opening incidents.
 PostgreSQL / SQLite
Stores incidents, audit trails, and check results with automated hourly aggregation to keep 90-day queries fast.
Go MemoryCache + WSIn-process thread-safe read-through caching, sliding-window rate limiting, and room-isolated WebSocket broadcasting.
Route each monitor to specific channels and assign a Person-in-Charge. Every dispatch attempt is recorded for auditability.
SlackBlock Kit payloads with target URL, failure reason, and incident link.
DiscordColor-coded rich embeds for incident open, degraded, and resolved states.
HTML incident and recovery notifications over your own SMTP relay.
Structured JSON events with strict private-network SSRF protection.
Answers on deployment, monitoring protocols, alert rules, data retention, and licensing.
Run "npx netra-uptime start" (or pnpm dlx, yarn dlx, bunx) to generate a production-ready .env and docker-compose.yml with secure random credentials in ~/.netra-uptime and start the 2-service stack (postgres + netra-uptime with built-in in-memory caching). The CLI provides full lifecycle management: start, stop, status, logs, update, and credentials. You can also deploy Netra Uptime as a standalone single-binary with embedded SQLite (DB_DRIVER=sqlite) or clone the repository and run "docker compose up -d" manually.